Insurance
The price of fragmentation: what disconnected systems are costing P&C insurers
Federato

July 30, 2026
Ask a P&C underwriter what slows them down, and most likely the answer doesn’t start with "risk selection." It starts with the fourth system they had to open just to confirm a policy number, or the spreadsheet someone keeps because the core system doesn't show portfolio context.
Federato surveyed 750 P&C insurance professionals across carriers, MGAs, and MGA aggregators for the 2026 State of P&C Insurance Technology report to find out how they’re using AI, what’s taking up their time, and the impact AI and time are having on business outcomes. The research surfaced three interconnected themes: the high cost of fragmentation, the gap between what leaders believe and teams experience, and how AI is being used to drive results.
This is the first in a series of posts that will dive into the report's key findings. Today’s focus is on the hours lost to coordinating across systems, and the underwriting decisions that drift away from strategy once that coordination breaks down.
The coordination tax is the accumulated cost of manual coordination work: moving between systems, searching for information, reconciling conflicting data, and waiting on approvals before a decision can actually get made. None of the systems underneath were built to talk to each other, so the tax gets paid on nearly every task that touches more than one of them.
One vice president at a carrier writing $1 billion to $4.9 billion in premium described it this way:
"Data entry across multiple legacy systems is highly manual, especially when duplicating policy, claims, or customer information between platforms."
The number behind that complaint: employees lose an average of 5 hours a week to this overhead, which Federato modeled at $10,145 per employee per year. Across a 100-person operations team, that's over $1 million annually. At 500 people, it's roughly $5.1 million, a sum most finance teams would flag if it showed up as a line item instead of hiding inside everyone's calendar.
The report breaks that 5-hour average down further, task by task, as well as by company size, and translates the lost time into a full-time-equivalent headcount most operations leaders haven't put a number on yet.
A reasonable assumption is that bigger carriers have solved this with bigger IT budgets. The research doesn't support that. Employees at the largest organizations report spending more time on fixing errors caused by missing or outdated data, re-entering information between systems, and searching for context than employees at smaller organizations report. Adding systems as a company grows adds handoffs, and each handoff adds its own small tax that compounds across a larger workforce.
Underwriters now navigate an average of 6.8 systems to evaluate a single submission, up from 6.4 last year. Alongside that increase, average wasted effort, meaning time spent on work that doesn't produce a successful outcome, rose from 26% in 2025 to 31% in 2026, and submissions falling outside appetite grew from 26% to 30%. The more severe cases moved faster: severe wasted effort more than doubled, and severe appetite drift climbed from 18% to 39%.
Visibility into the problem hasn't caught up. While 91% of leaders report good or full visibility into their KPIs, only 11% of underwriters say they can detect and respond to portfolio changes in real time. Asked how they keep submissions aligned with guidelines in the absence of that visibility, one underwriter at an MGA aggregator gave a simple and revealing answer: "I personally review underwriting guidelines and match them manually with each submission we receive."
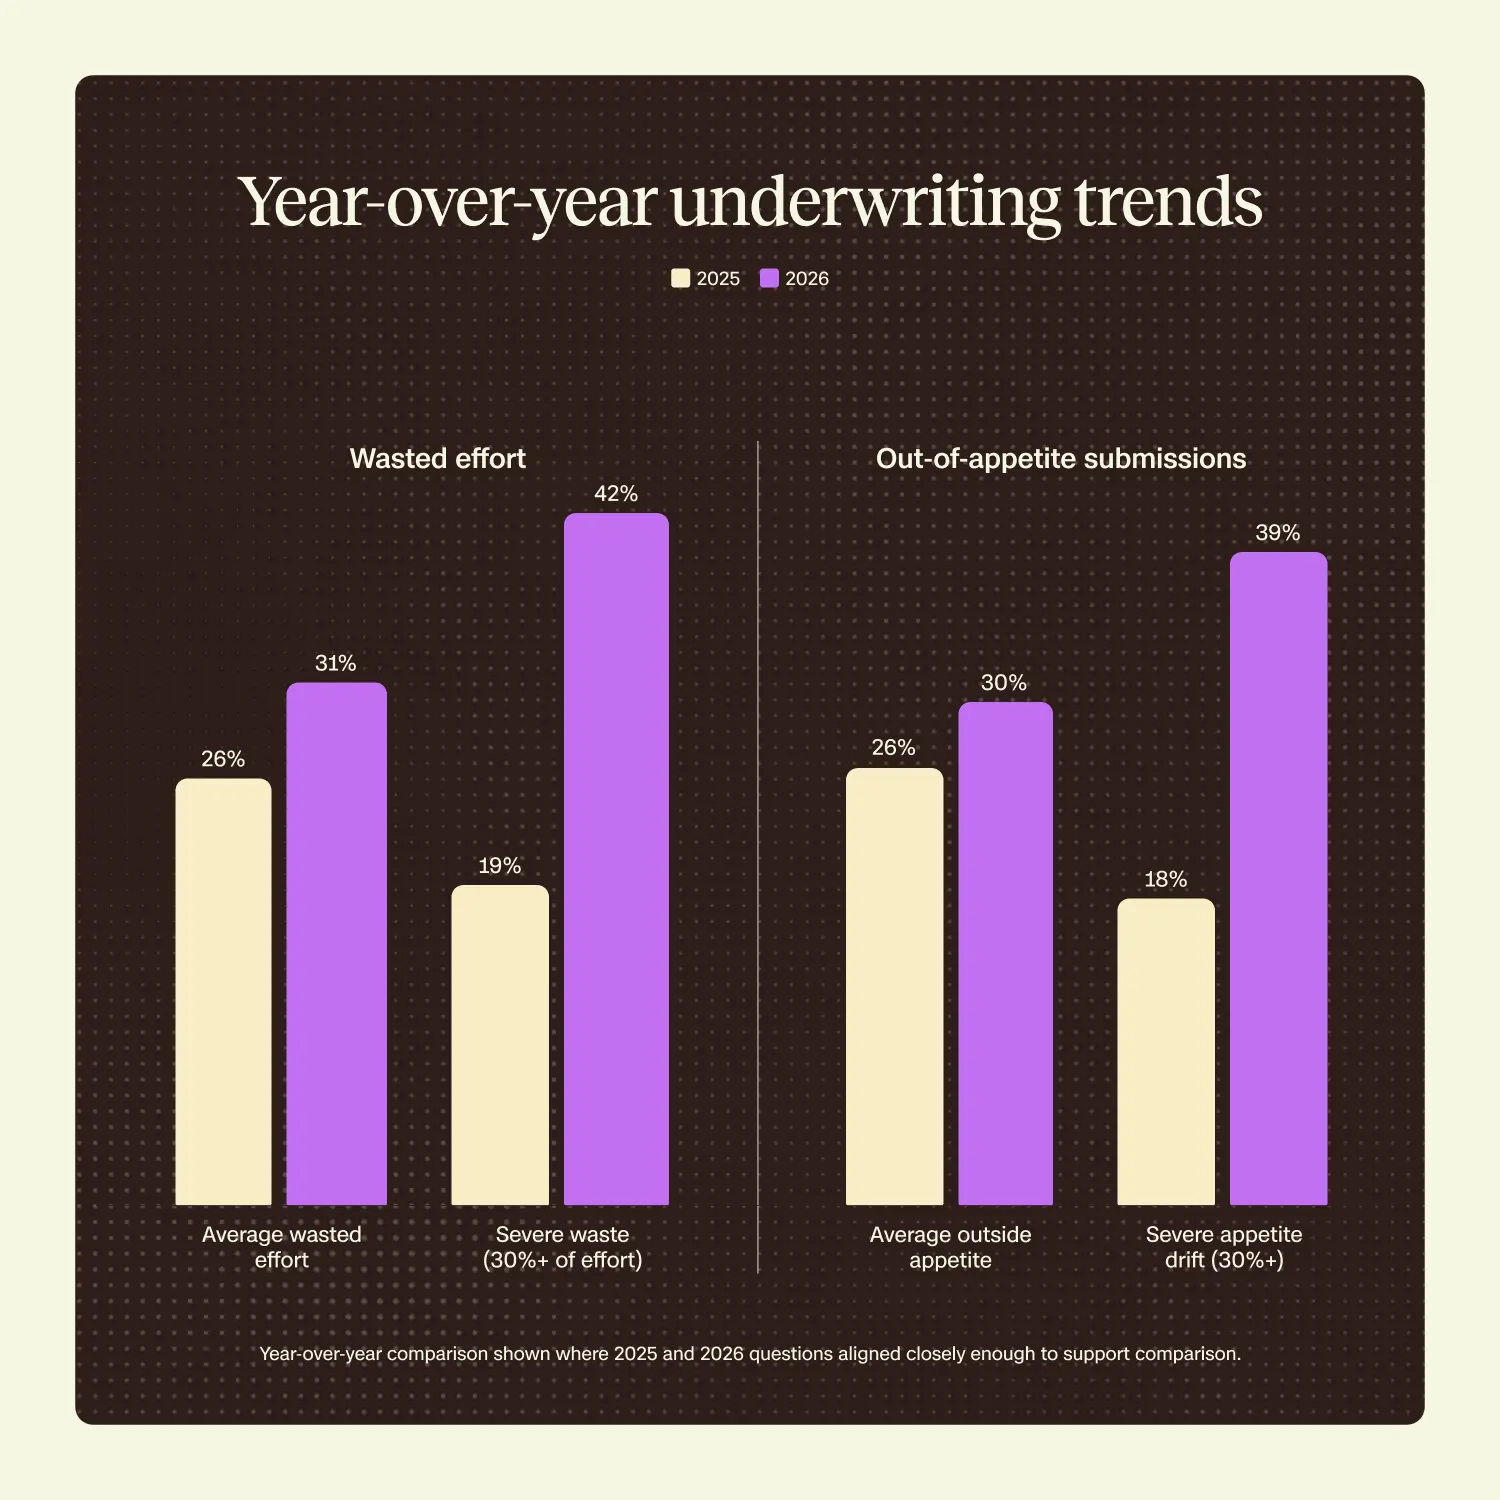
The coordination tax doesn’t cause this drift. The two trends rise together from the same underlying condition: systems that don't share data, context, or guidance at the point of decision.
Read the full report to learn how that drift shows up differently depending on how mature an organization's AI and workflow integration is. And more importantly, how the insurers that are getting better business outcomes with AI are doing it.
And stay tuned for our next post in this series, which will focus on the gap between what leadership believes and their teams experience.