Insurance
Why most insurers are spending more on AI, but not getting more value
Federato

July 23, 2026

P&C insurance premiums have hit $2.4 trillion globally, double the size of the market 20 years ago. In the US alone, direct premiums written recently crossed $1 trillion for the first time. By most measures, the industry is growing.
But growth and value are not the same thing. In 2025, ACORD found that 48 of the 100 largest US P&C carriers actually destroyed value, up from 36 in 2022 and just 9 in 2021. Across industries, only 12% of CEOs say AI has delivered both cost and revenue benefits, and 69% report little to no change in revenue from AI at all.
Why are some insurers getting better business outcomes from AI than others? We surveyed 750 insurance leaders and professionals from carriers, MGAs, and aggregators to understand the difference between AI adoption and AI value.
The result is the 2026 State of P&C Insurance Technology report, and the data is clear: AI value comes from integration depth, not adoption volume. The insurers embedding AI into workflows see measurably better outcomes than those layering it on top.
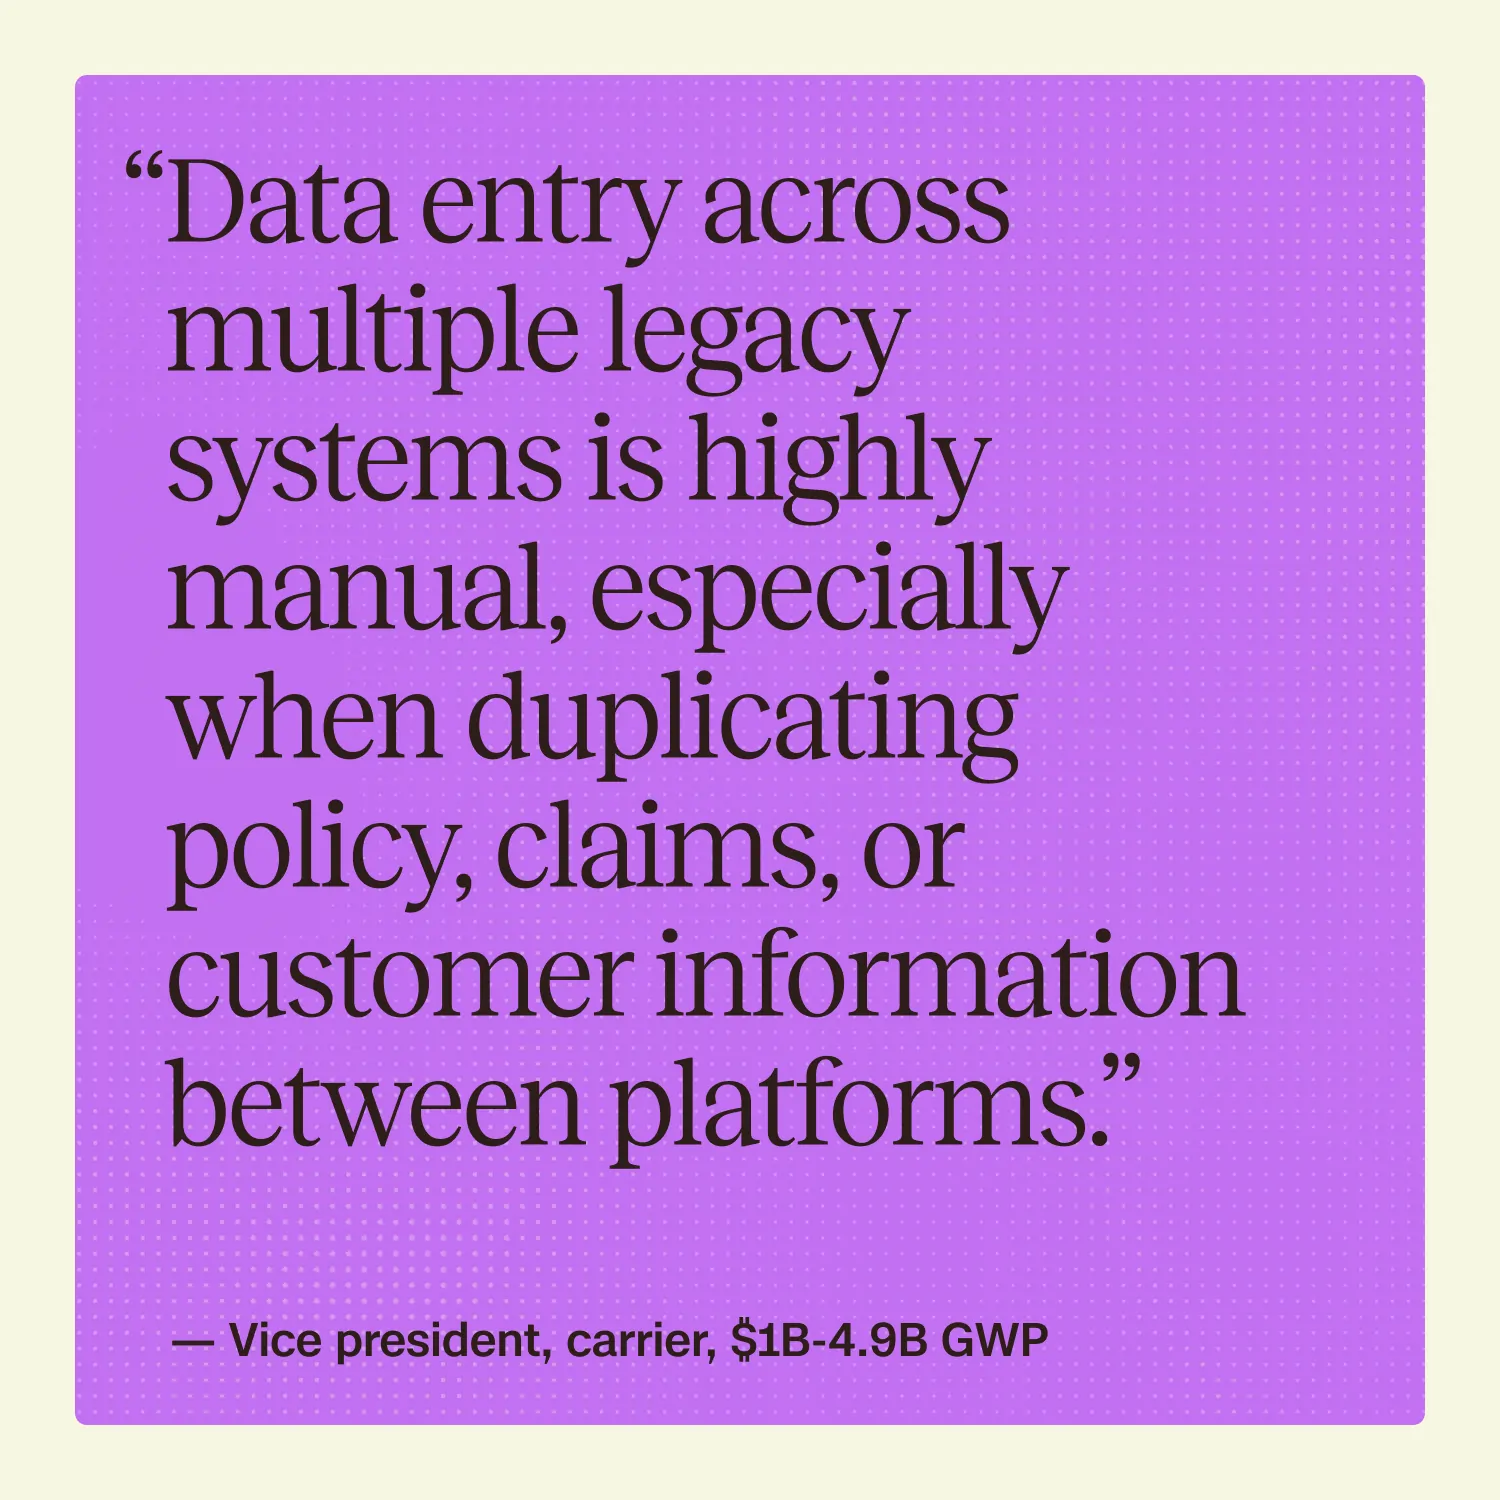
Ask underwriters and operations teams where their time actually goes, and a pattern quickly emerges: fixing errors caused by missing data, re-entering information across systems, reconciling numbers that don't match, and waiting on approvals that should take minutes instead of days.
Federato's research puts a number on it. P&C teams lose an average of 5 hours per employee, per week, to this kind of manual coordination work, equal to an estimated $10,145 per employee each year. At scale, that cost compounds fast, and it doesn't shrink as organizations grow. It grows with them.
The full report breaks down exactly where that time goes by task, how the cost multiplies across team sizes, and why the largest insurers feel it the most.
The coordination tax shows up most visibly in underwriting, where submissions, appetite guidance, and portfolio context often live in entirely different places. When that context isn't available at the point of decision, underwriters end up spending real time evaluating risk that was never going to fit the strategy.
The year-over-year trend is moving in the wrong direction. Average wasted effort rose from 26% in 2025 to 31% in 2026, and the share of teams in the severe category grew even faster. Out-of-appetite submissions are following the same trajectory.
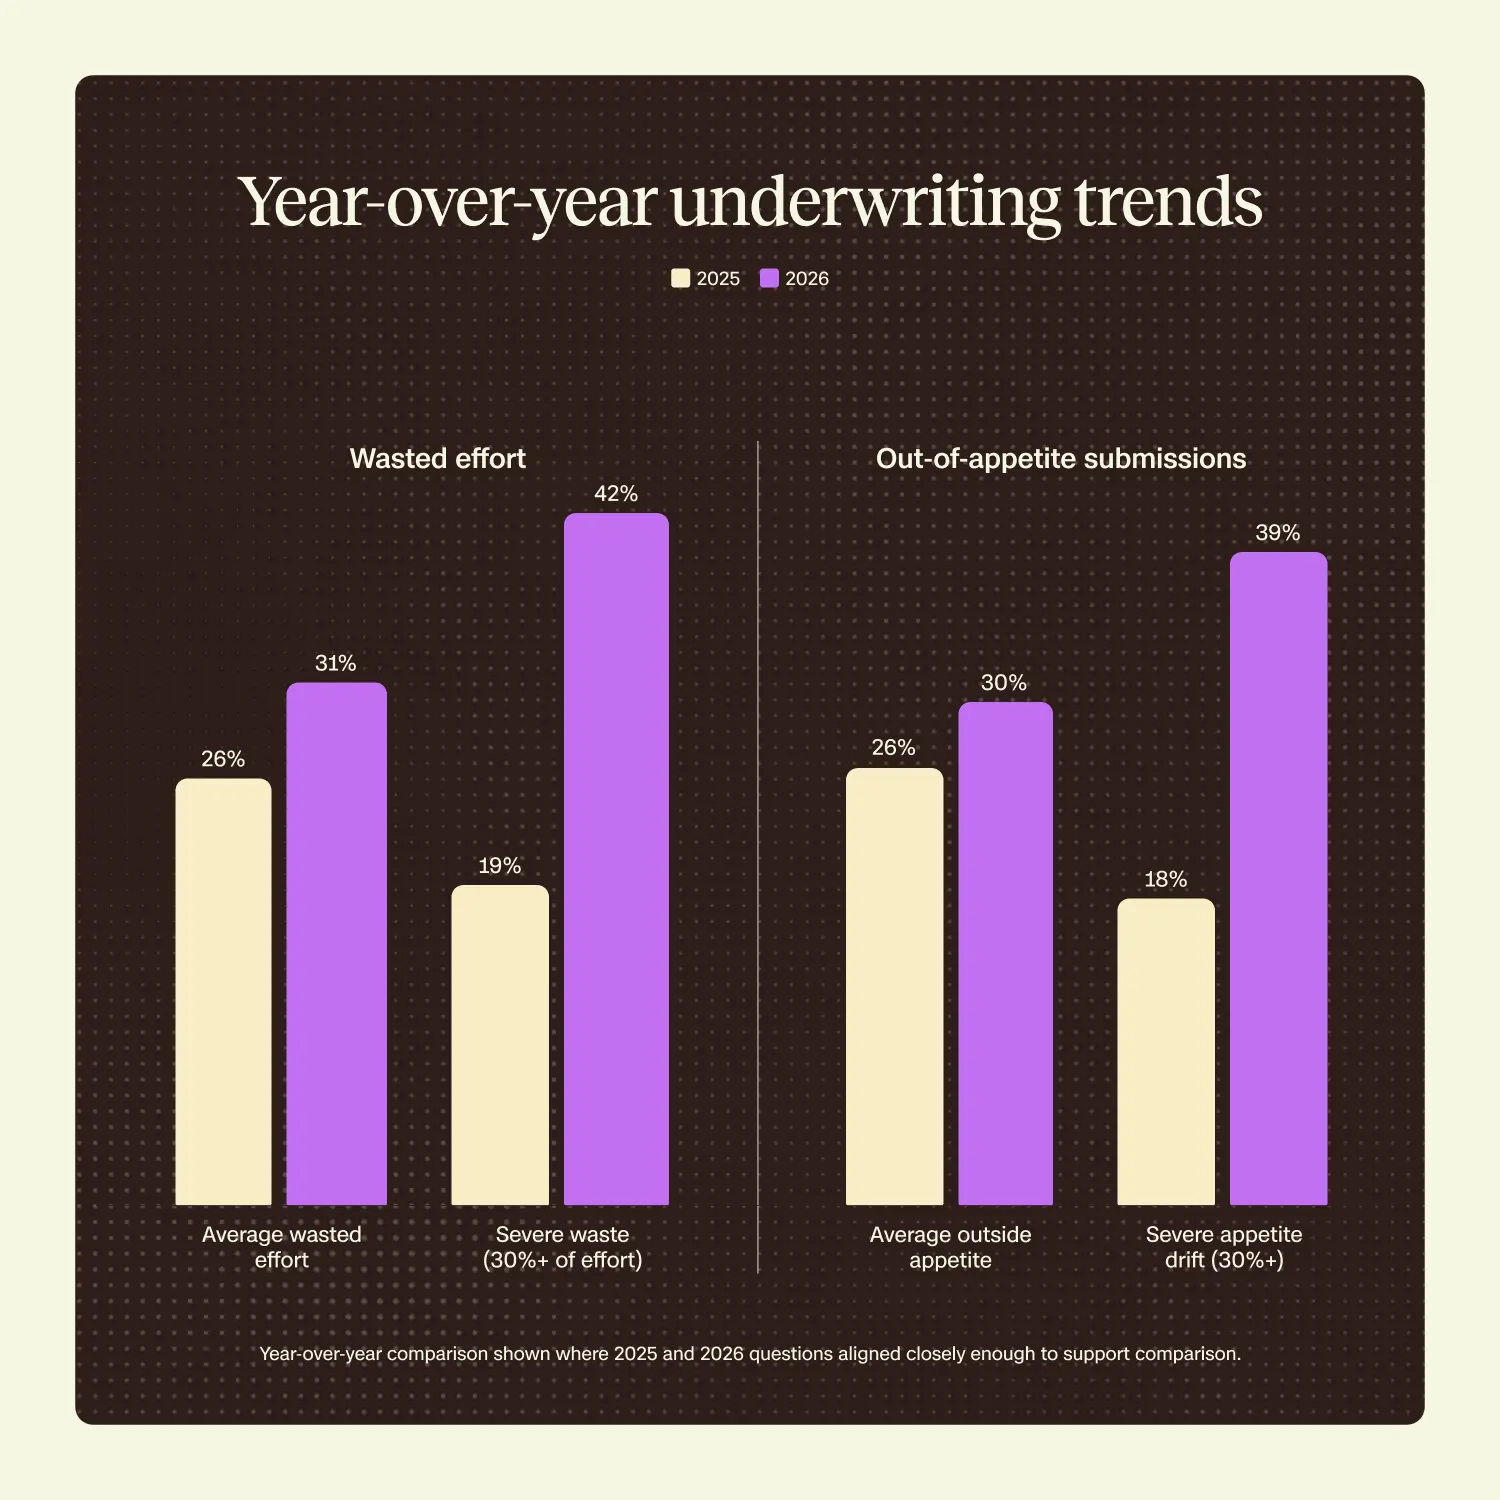
Part of the problem is visibility. Most underwriters are working from static guidelines and periodic reports, not the current state of the book, which leaves plenty of room for strategy and execution to drift apart without anyone noticing until the numbers show up months later. The full report has the underwriter-level visibility data and the exact scale of the drift.
This is where the research gets uncomfortable for a lot of leadership teams. Executives report strong alignment across the organization. Underwriters describe a different reality entirely.
93% of leaders believe guidelines and strategy are applied consistently across teams. Underwriters tell a different story: 88% report deviations at least occasionally, caused by missing data, disconnected tools, or workflow limitations. The perception gap also applies to KPI visibility, where 91% of leaders say they have good or full KPI visibility, but only 27% of underwriters agree.
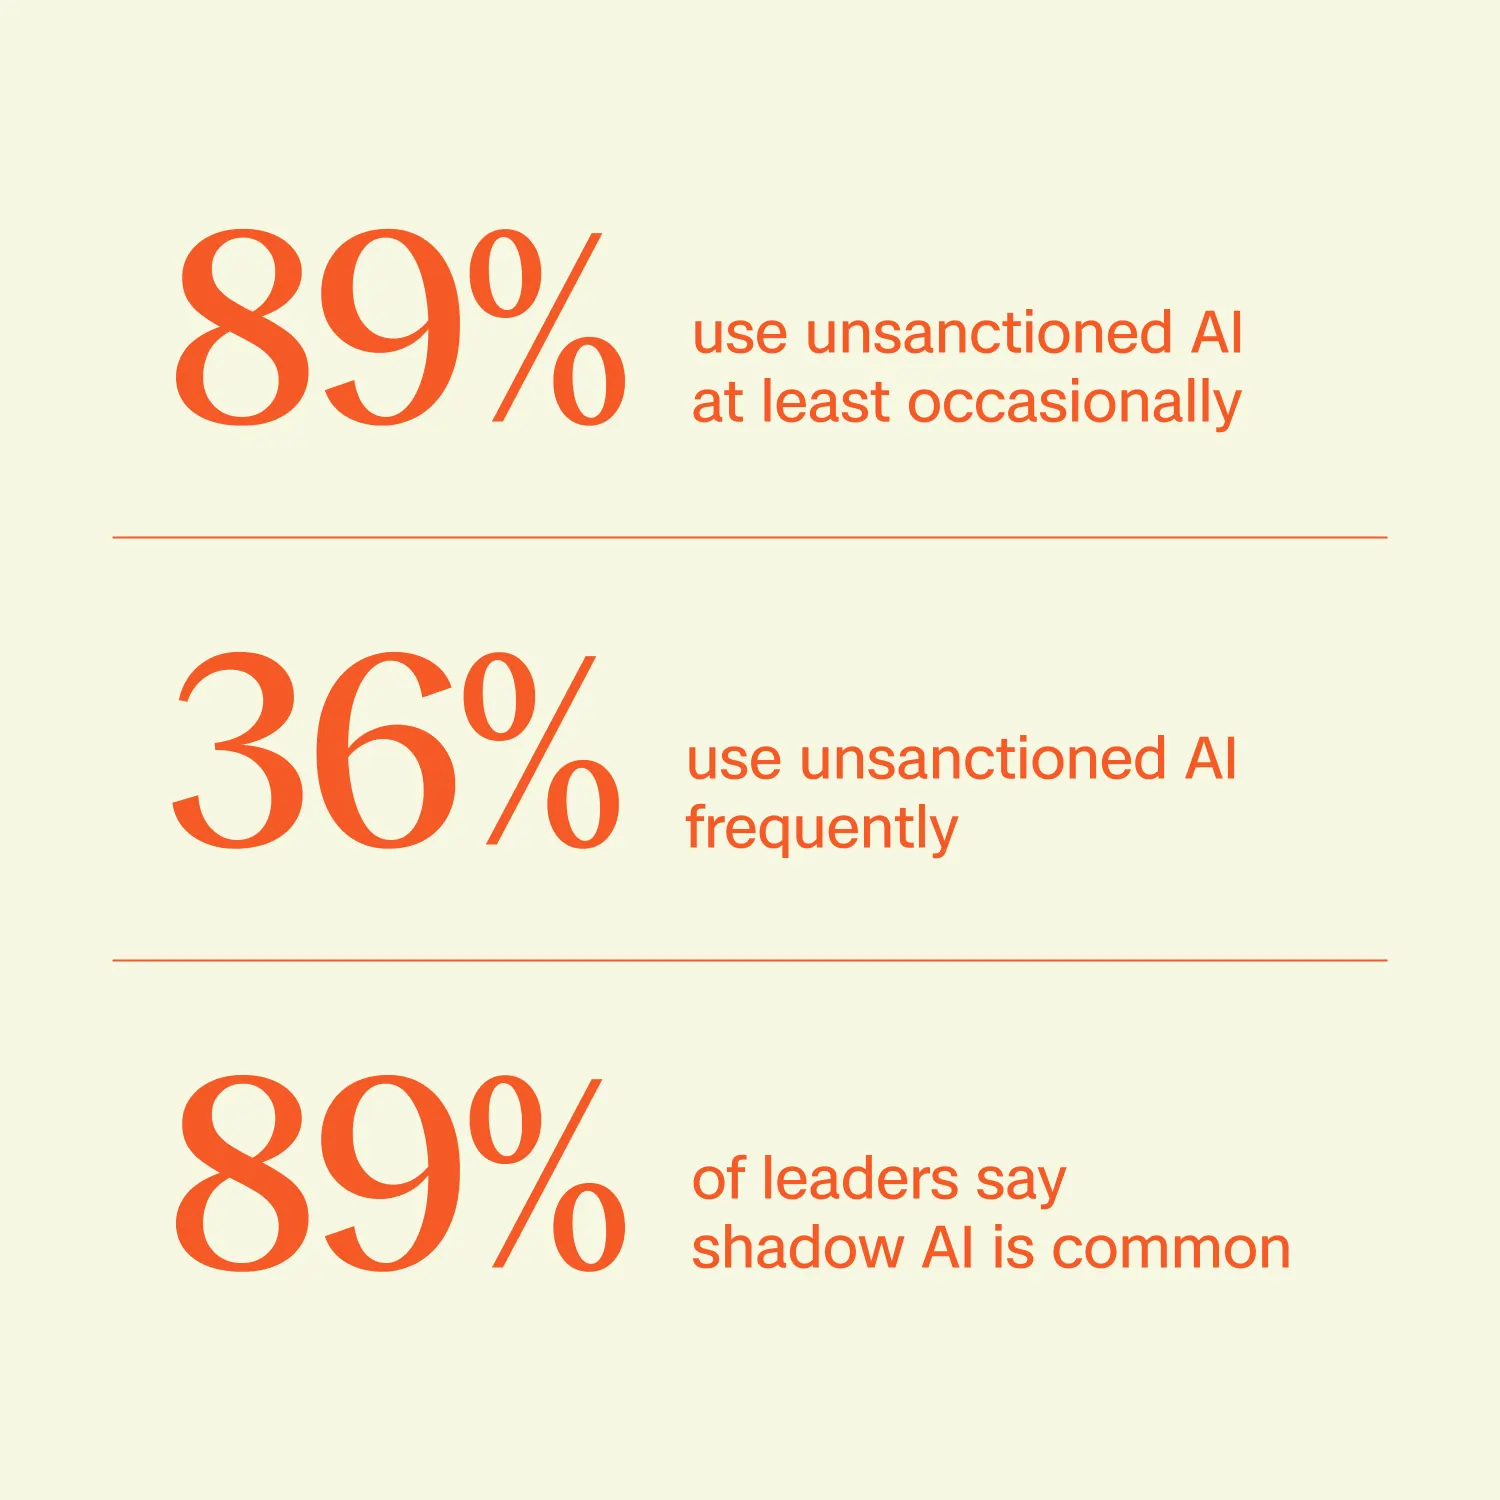
Employees aren't waiting for approved tools to catch up. 89% of employees report using unsanctioned AI tools at least occasionally, and the behavior isn't limited to the frontline. VPs and directors report the highest rates of frequent use, ahead of both individual contributors and the C-suite.
That creates real exposure. Sensitive underwriting data and portfolio details can end up in third-party models with no audit trail, in an industry where data governance is foundational, not optional. The full report breaks down where shadow AI is concentrated, what's driving it, and what it signals about the gap between the tools employees are given and the tools they actually need.
Here's the finding that ties everything above together: the problem was never how much AI insurers are using. It's how connected that AI is to the workflows and systems where decisions actually get made.
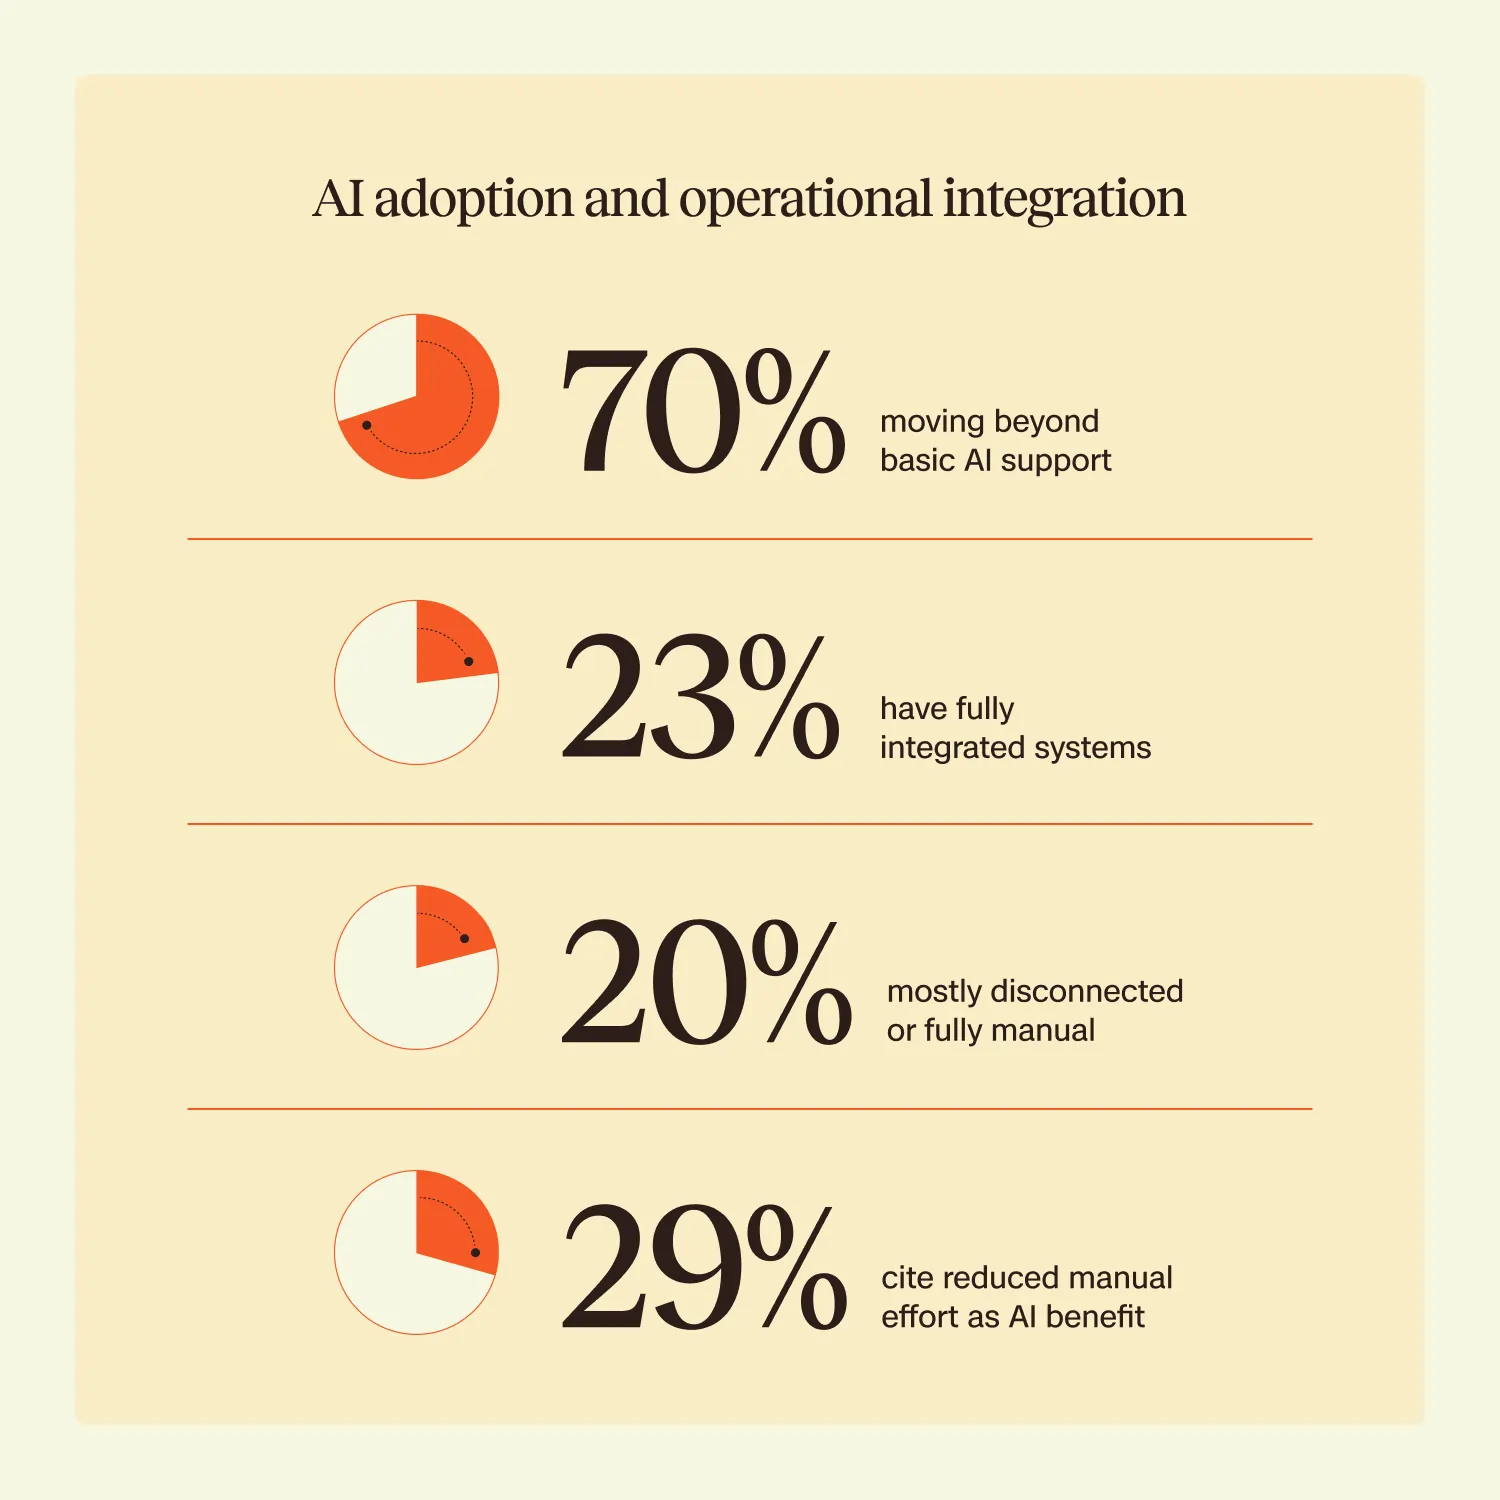
70% of insurers report moving beyond basic AI support. Only 23% say their systems are fully integrated. That gap is exactly why AI adoption hasn't translated into operational relief for most of the industry. AI layered onto a fragmented core adds another surface where friction accumulates, another tool that has to be checked, validated, and reconciled with everything else.
The organizations that have moved past that stage look meaningfully different. Insurers with broader AI integration are 3.6x more likely to report full real-time portfolio visibility than those using isolated AI tools. The gap is even wider on decision guidance specifically: only 10% of insurers still in the early stages of AI adoption report fully embedded, real-time decision guidance, compared with 47% of insurers with broad AI integration.
That's the difference between AI that assists a task and AI that changes how the decision gets made, not a marginal improvement on the same process. When AI sits inside the workflow rather than alongside it, portfolio context, appetite guidance, and performance data are available at the moment a decision is being made, not after the fact, not in a separate dashboard, not in a report someone has to go pull.
The insurers seeing results are the ones who stopped treating AI as a feature to add and instead focused on full system integration. The report lays out the five-stage AI maturity path from early experimentation to true integration, what separates each stage from the next, and where most of the industry actually sits today.
AI is everywhere in P&C insurance right now. The value isn't, at least not yet, for most of the market. The data shows exactly where that gap comes from and what closing it requires.
Download the full 2026 State of P&C Insurance Technology report for the complete findings, and insight into what separates the insurers pulling ahead from the rest.